Plotting the Temperature from an Energy File
This example reads an Gromacs energy file and plots the evolultion and mean of the temperature.
from matplotlib import pyplot as plt
import mdevaluate as md
import tudplot
tudplot.activate()
edr = md.open_energy('/data/niels/sim/water/bulk/300K/out/energy_water1000bulk300.edr')
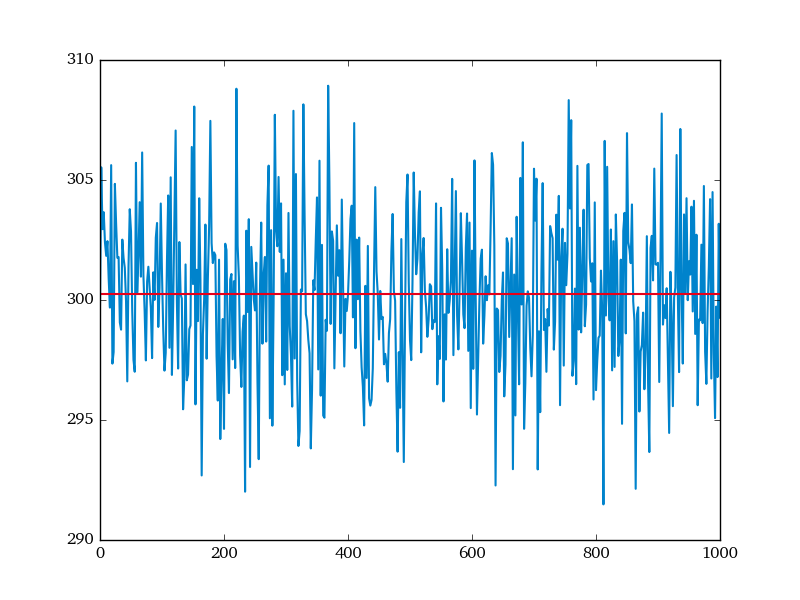
T = edr['Temperature']
plt.plot(edr.time, T)
plt.plot(edr.time[[0, -1]], [T.mean(), T.mean()])
Total running time of the script: (0 minutes 0.504 seconds)
Download Python source code:
plot_temperature.py
Download IPython notebook:
plot_temperature.ipynb